Mandelbrot Set Explorer
Click or drag a rectangle to zoom in.
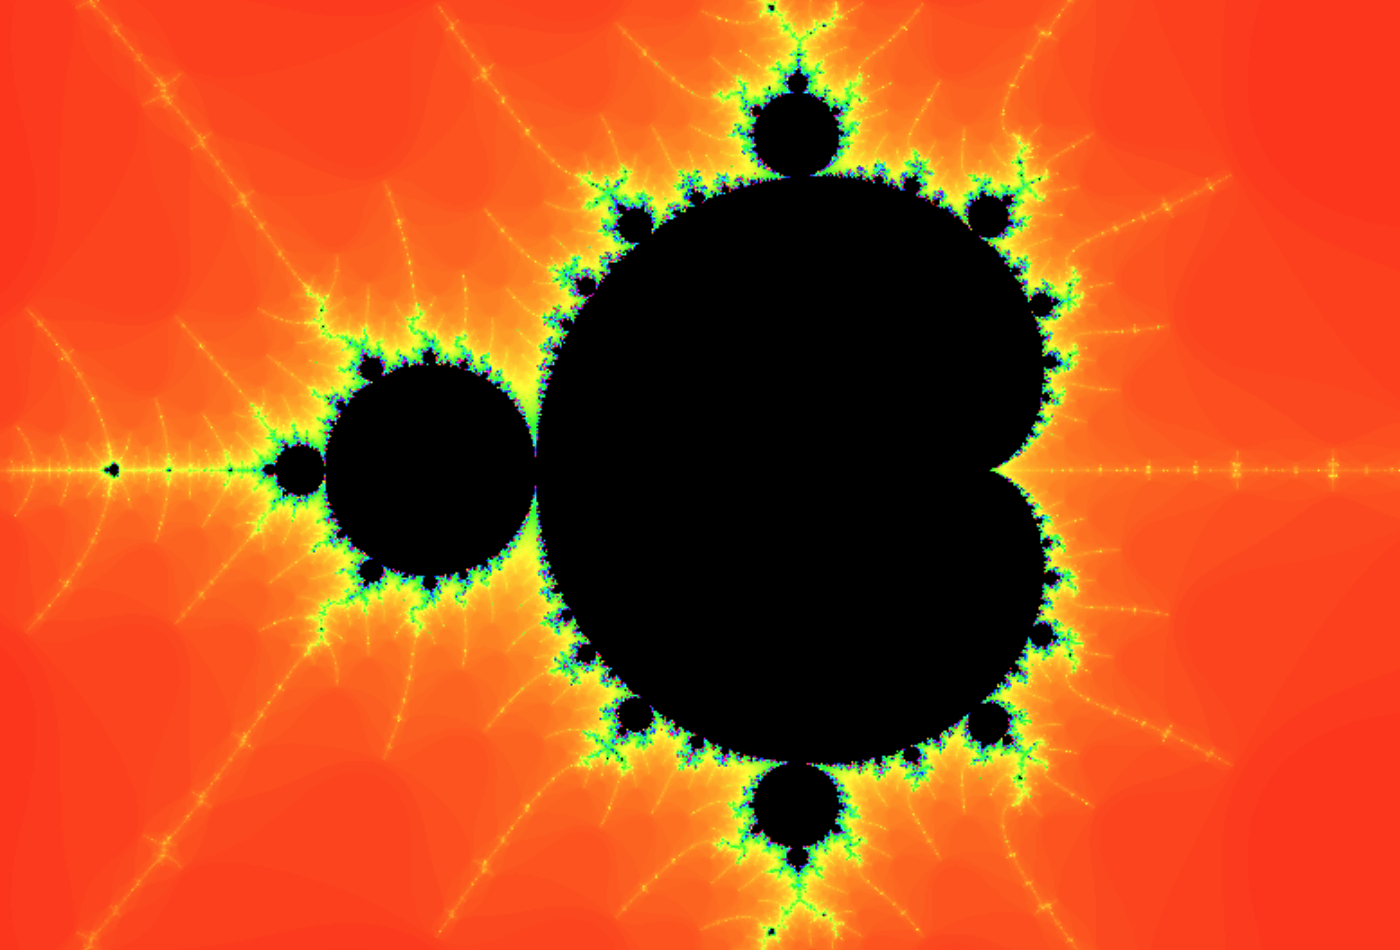
This is a visualization of the Mandelbrot set, a beautiful fractal defined by a simple equation. Later, I'll explain what exactly the Mandelbrot set is, but first I'm going to explain how to use this tool and find what are (in my opinion) the most interesting parts of the set.
How to use the explorer
The explorer renders a section of the Mandelbrot set. You can zoom in by clicking on something or drawing a new rectangle to render, or by pressing one of the buttons in the left panel. You can control the order that the frame is rendered using the "Drawing order" dropdown. I find that "Middle Out" is useful when zooming in on something specific. If the edges of the set (the black part) ever become smooth, it is a sign that you need to increase the iterations. More iterations take more time but increase the quality of the image in complicated areas of the set. If you zoom in far enough, the image may appear pixelated. That means you have reached the maximum zoom level that this explorer can render.Most people start out by zooming in on the multi-armed spirals near the edge of the main body of the set. These areas are OK, but in my opinion the coolest parts of the set are near "minibrots" or "satellites". Minibrots are little imperfect copies of the whole set that you can find scattered around. The largest minibrot appears as a little black mark directly to the left of the main body of the set.

Satellites, more funly referred to as minibrots. Interesting patterns appear near these imperfect copies of the larger set.

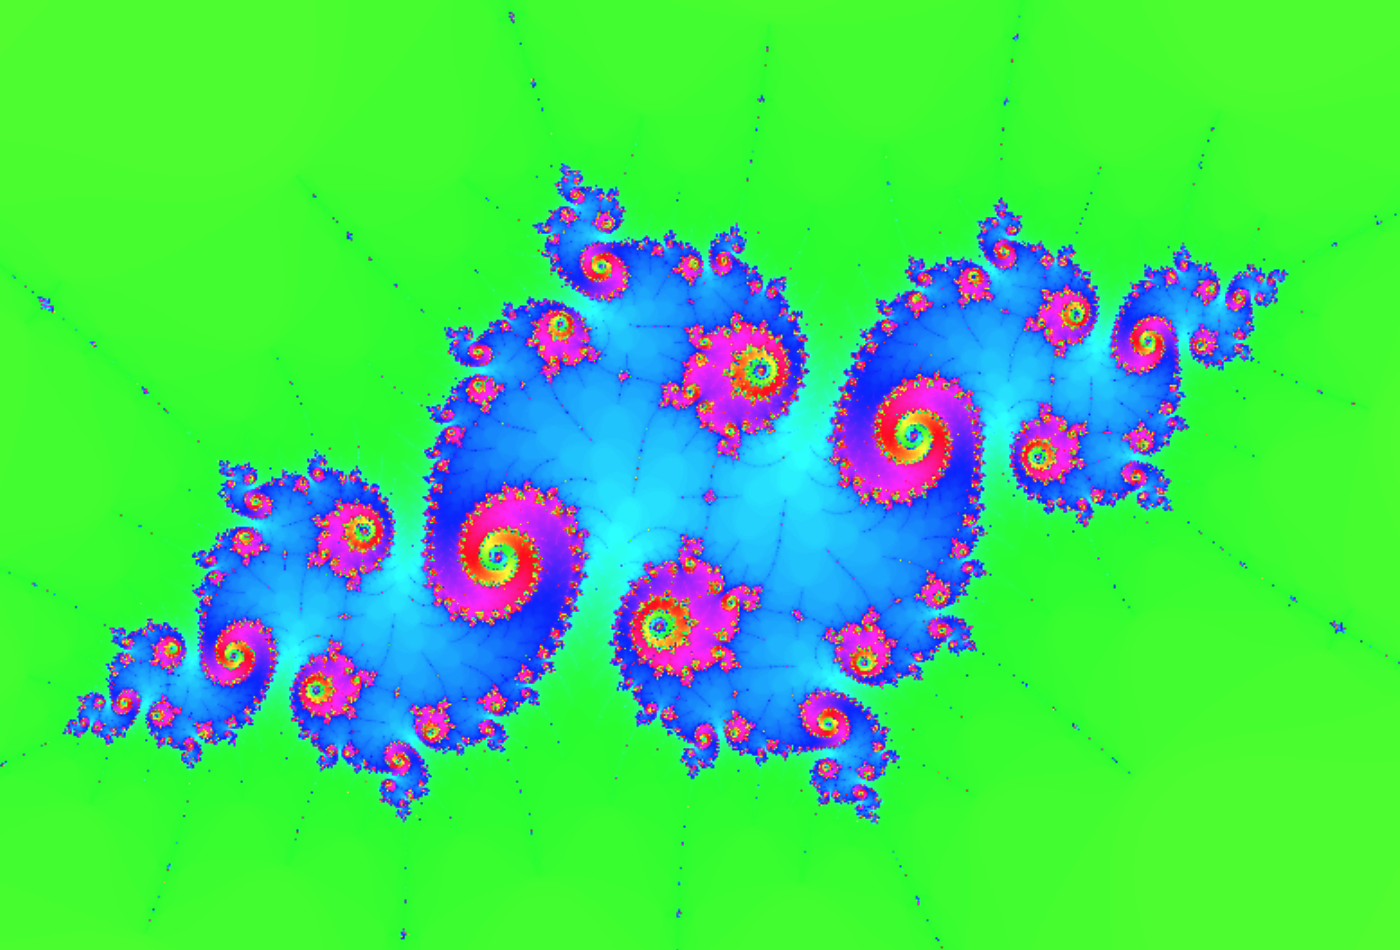

Embedded Julia sets, found near a minibrot, look very nice. At the center of each embedded Julia set is another minibrot. Left: the region between a minibrot's main cardioid (bean shape) and its largest bulb (circle). Middle: An embedded Julia set found in this region. Right: The minibrot at the center of the embedded Julia set.
What is the Mandelbrot set?
The way these images are generated is surprisingly simple, and you don't have to know much math at all to understand it.The mathy version: Let's define a function $$ f (n, c)= \begin{cases} f (n-1, c)^2+c& \text{if } n>0\\ 0 & \text{if } n=0\\ \end{cases} $$ where \(n\) is an integer and \(c\) is a complex number. The Mandelbrot set is the set of all complex numbers \(c\) for which \(\mid f(n, c) \mid\) does not explode to infinity as \(n\) approaches infinity.
The less-mathy version: This version is less difficult to understand, but you do need to understand 2D coordinates and the formula for 2D distance (sqrt of x squared plus y squared). The definition of the Mandelbrot set involves complex numbers. All you need to know about complex numbers is that they have 2 components. You could think of them as x and y coordinates, like a point on a map. Here's how the Mandelbrot set is generated:
- Pick a point in 2D space, in this case a pixel on the screen. Create a complex number called \(c\) which has the point's coordinates.
- Create another complex number with coordinates (0,0), which we'll call \(z\).
- Add \(c\)'s coordinates to \(z\)'s coordinates. For example, if \(c\) is at coordinates (1, 2), add 1 to \(z\)'s \(x\) coordinate and 2 to \(z\)'s \(y\) coordinate.
- Square \(z\)'s length. Length in this case means distance from the point (0,0). So, take \(z\)'s distance from (0,0), square it, and move \(z\) so that it is the new distance away from (0,0). The direction from (0,0) to \(z\) should stay the same.
- Double the angle from (0,0) to \(z\). An angle of zero would mean \(z\) is directly right of (0,0), a 90 degree angle is above (0,0), a 180 degree angle is left of (0,0), and a 270 degree angle is below (0,0). Take that angle and double it. If the resulting number is above 360, subtract 360 from it. Move \(z\) to the new angle. Keep it the same distance from (0,0).
- Repeat steps 3-5 over and over. If the distance from (0,0) to \(z\) ever exceeds 2, the original point \(c\) is not in the Mandelbrot set. Otherwise, \(c\) is in the Mandelbrot set and we color it black. In reality, we only repeat steps 3-5 a certain number of times before estimating that a point will never exceed a distance of 2. That is our iteration count.